Springboot integrated prometheus quick start demo
一、introduction
prometheus
Prometheus is a system monitoring and alerting toolkit developed as open source software on Soundcloud by former Google engineers in 2012. Since then, many companies and organizations have adopted Prometheus as a monitoring and alerting tool. Prometheus has a very active developer and user community, and it is now an independent open source project that can be maintained independently of any company. To prove this point, Prometheus joined the CNCF Foundation in May 2016, becoming the second CNCF managed project after Kubernetes
grafana
Grafana is a monitoring instrument system. It is a system monitoring tool open sourced by Grafana Labs. It can greatly help us simplify the complexity of monitoring. We only need to provide the data that needs to be monitored, and it can help generate various visual instruments. , and it also has an alarm function that can send notifications when there is a problem with the system.
二、 environment setup
Docker-compose is used here to build a test environment. The specific configuration is as follows
docker-compose-prometheus.yml
# images choose https://hub.docker.com/search?q=&type=image
version: "3"
# bridge-> communicate easily
networks:
  prometheus:
    ipam:
      driver: default
      config:
        - subnet: "172.22.0.0/24"
services:
  # open source monitor and alert system
  prometheus:
    image: registry.cn-hangzhou.aliyuncs.com/zhengqing/prometheus:v2.34.0             # 原镜像`prom/prometheus:v2.34.0`
    container_name: prometheus
    restart: unless-stopped
    volumes:
      - ./prometheus/prometheus.yml:/etc/prometheus/prometheus.yml
    command: "--config.file=/etc/prometheus/prometheus.yml --storage.tsdb.path=/prometheus"
    ports:
      - "9090:9090"
    depends_on:
      - node-exporter
    networks:
      prometheus:
        ipv4_address: 172.22.0.11
  # collect metrics
  node-exporter:
    image: registry.cn-hangzhou.aliyuncs.com/zhengqing/node-exporter:v1.3.1           # old image`prom/node-exporter:v1.3.1`
    container_name: prometheus-node-exporter
    restart: unless-stopped
    ports:
      - "9100:9100"
    networks:
      prometheus:
        ipv4_address: 172.22.0.22
  # ui show
  # https://grafana.com/docs/grafana/latest/installation/docker
  grafana:
    image: registry.cn-hangzhou.aliyuncs.com/zhengqing/grafana:8.0.0               # 原镜像`grafana/grafana:8.0.0`
    container_name: prometheus-grafana
    restart: unless-stopped
    ports:
      - "3000:3000"
    volumes:
      - "./prometheus/grafana/grafana.ini:/etc/grafana/grafana.ini" # mail configuration
#      - "./prometheus/grafana/grafana-storage:/var/lib/grafana"
#      - "./prometheus/grafana/public:/usr/share/grafana/public" # 这里面可处理汉化包 可参考 https://github.com/WangHL0927/grafana-chinese
#      - "./prometheus/grafana/conf:/usr/share/grafana/conf"
#      - "./prometheus/grafana/log:/var/log/grafana"
#      - "/etc/localtime:/etc/localtime"
    environment:
      GF_EXPLORE_ENABLED: "true"
      GF_SECURITY_ADMIN_PASSWORD: "admin"
      GF_INSTALL_PLUGINS: "grafana-clock-panel,grafana-simple-json-datasource,alexanderzobnin-zabbix-app"
      # 持久化到mysql数据库
      GF_DATABASE_URL: "mysql://root:root@172.22.0.34:3306/grafana" # TODO 修改
    depends_on:
      - prometheus
      - mysql
    networks:
      prometheus:
        ipv4_address: 172.22.0.33
  # mysql数据库 => 用于grafana持久化数据
  mysql:
    image: registry.cn-hangzhou.aliyuncs.com/zhengqing/mysql:5.7
    container_name: prometheus-mysql
    restart: unless-stopped
    volumes:
      - "./prometheus/mysql5.7/my.cnf:/etc/mysql/my.cnf"
      - "./prometheus/mysql5.7/data:/var/lib/mysql"
      - "./prometheus/mysql5.7/log/mysql/error.log:/var/log/mysql/error.log"
    environment:
      TZ: Asia/Shanghai
      LANG: en_US.UTF-8
      MYSQL_ROOT_PASSWORD: root         # 设置root用户密码
      MYSQL_DATABASE: grafana           # 初始化数据库grafana
    ports:
      - "3306:3306"
    networks:
      prometheus:
        ipv4_address: 172.22.0.34
start test environment
docker-compose-prometheus.yml need to modify the mysql connection for grafanaprometheus.yml Configure yourself
# 运行
docker-compose -f docker-compose-prometheus.yml -p prometheus up -d
# 查看grafana日志
docker logs -fn10 prometheus-grafana- grafana access url:
http://ip:3000default account/password:admin/admin - prometheus access url:
http://ip:9090 - exporter access url:
http://ip:9100/metrics

三、code project
let us to do a little experiment,Implement custom monitoring indicators
pom.xml
<?xml version="1.0" encoding="UTF-8"?>
<project xmlns="http://maven.apache.org/POM/4.0.0"
         xmlns:xsi="http://www.w3.org/2001/XMLSchema-instance"
         xsi:schemaLocation="http://maven.apache.org/POM/4.0.0 http://maven.apache.org/xsd/maven-4.0.0.xsd">
    <parent>
        <artifactId>springboot-demo</artifactId>
        <groupId>com.et</groupId>
        <version>1.0-SNAPSHOT</version>
    </parent>
    <modelVersion>4.0.0</modelVersion>
<artifactId>prometheus</artifactId>
    <properties>
        <maven.compiler.source>8</maven.compiler.source>
        <maven.compiler.target>8</maven.compiler.target>
    </properties>
    <dependencies>
        <dependency>
            <groupId>org.springframework.boot</groupId>
            <artifactId>spring-boot-starter-web</artifactId>
        </dependency>
        <dependency>
            <groupId>org.springframework.boot</groupId>
            <artifactId>spring-boot-autoconfigure</artifactId>
        </dependency>
        <dependency>
            <groupId>org.springframework.boot</groupId>
            <artifactId>spring-boot-starter-actuator</artifactId>
        </dependency>
        <dependency>
            <groupId>io.micrometer</groupId>
            <artifactId>micrometer-core</artifactId>
        </dependency>
        <dependency>
            <groupId>io.micrometer</groupId>
            <artifactId>micrometer-registry-prometheus</artifactId>
        </dependency>
    </dependencies>
</project>
application.properties
server.port=8088
spring.application.name=springboot2-prometheus
management.endpoints.web.exposure.include=*
management.metrics.tags.application=${spring.application.name}
PrometheusCustomMonitor.java
package com.et.prometheus.monitor;
import io.micrometer.core.instrument.Counter;
import io.micrometer.core.instrument.DistributionSummary;
import io.micrometer.core.instrument.MeterRegistry;
import org.springframework.beans.factory.annotation.Autowired;
import org.springframework.stereotype.Component;
import javax.annotation.PostConstruct;
import java.util.concurrent.atomic.AtomicInteger;
@Component
public class PrometheusCustomMonitor {
    private Counter requestErrorCount;
    private Counter orderCount;
    private DistributionSummary amountSum;
    private AtomicInteger failCaseNum;
    private final MeterRegistry registry;
    @Autowired
    public PrometheusCustomMonitor(MeterRegistry registry) {
        this.registry = registry;
    }
    @PostConstruct
    private void init() {
        requestErrorCount = registry.counter("requests_error_total", "status", "error");
        orderCount = registry.counter("order_request_count", "order", "test-svc");
        amountSum = registry.summary("order_amount_sum", "orderAmount", "test-svc");
        failCaseNum = registry.gauge("fail_case_num", new AtomicInteger(0));
    }
    public Counter getRequestErrorCount() {
        return requestErrorCount;
    }
    public Counter getOrderCount() {
        return orderCount;
    }
    public DistributionSummary getAmountSum() {
        return amountSum;
    }
    public AtomicInteger getFailCaseNum() {
        return failCaseNum;
    }
}
GlobalExceptionHandler.java
package com.et.prometheus.exception;
import com.et.prometheus.monitor.PrometheusCustomMonitor;
import org.springframework.web.bind.annotation.ControllerAdvice;
import org.springframework.web.bind.annotation.ExceptionHandler;
import org.springframework.web.bind.annotation.ResponseBody;
import javax.annotation.Resource;
@ControllerAdvice
public class GlobalExceptionHandler {
    @Resource
    private PrometheusCustomMonitor monitor;
    @ResponseBody
    @ExceptionHandler(value = Exception.class)
    public String handle(Exception e) {
        monitor.getRequestErrorCount().increment();
        return "error, message: " + e.getMessage();
    }
}
TestController.java
package com.et.prometheus.controller;
import com.et.prometheus.monitor.PrometheusCustomMonitor;
import org.springframework.web.bind.annotation.RequestMapping;
import org.springframework.web.bind.annotation.RequestParam;
import org.springframework.web.bind.annotation.RestController;
import javax.annotation.Resource;
import java.util.Random;
@RestController
public class TestController {
    @Resource
    private PrometheusCustomMonitor monitor;
    @RequestMapping("/order")
    public String order(@RequestParam(defaultValue = "0") String flag) throws Exception {
        // 统计下单次数
        monitor.getOrderCount().increment();
        if ("1".equals(flag)) {
            throw new Exception("出错啦");
        }
        Random random = new Random();
        int amount = random.nextInt(100);
        // 统计金额
        monitor.getAmountSum().record(amount);
        monitor.getFailCaseNum().set(amount);
        return "下单成功, 金额: " + amount;
    }
}
DemoApplication.java:
package com.et.prometheus;
import org.springframework.boot.SpringApplication;
import org.springframework.boot.autoconfigure.SpringBootApplication;
@SpringBootApplication
public class DemoApplication {
   public static void main(String[] args) {
      SpringApplication.run(DemoApplication.class, args);
   }
}
code repository
四、test
Start the springboot service, visit http://localhost:8089/order and http://localhost:8089/order?flag=1 to simulate the success and failure of the order, and then we visit http://localhost:8088/actuator /prometheus, you can see that our custom indicators have been exposed by the /prometheus endpoint
# TYPE order_request_count_total counter
order_request_count_total{application="springboot2-prometheus",order="test-svc",} 34.0
# HELP jvm_threads_daemon_threads The current number of live daemon threads
# TYPE jvm_threads_daemon_threads gauge
jvm_threads_daemon_threads{application="springboot2-prometheus",} 18.0
# HELP jvm_classes_loaded_classes The number of classes that are currently loaded in the Java virtual machine
# TYPE jvm_classes_loaded_classes gauge
jvm_classes_loaded_classes{application="springboot2-prometheus",} 7250.0
# HELP order_amount_sum_max
# TYPE order_amount_sum_max gauge
order_amount_sum_max{application="springboot2-prometheus",orderAmount="test-svc",} 97.0
# HELP order_amount_sum
# TYPE order_amount_sum summary
order_amount_sum_count{application="springboot2-prometheus",orderAmount="test-svc",} 34.0
order_amount_sum_sum{application="springboot2-prometheus",orderAmount="test-svc",} 1482.0
Configure customized monitoring parameters on grafana
Visit http://localhost:3000/login, the initial account/password is: admin/admin
1、Configure data source
Click Add Data Source in the gear Configuration on the left, and you will see the following interface:
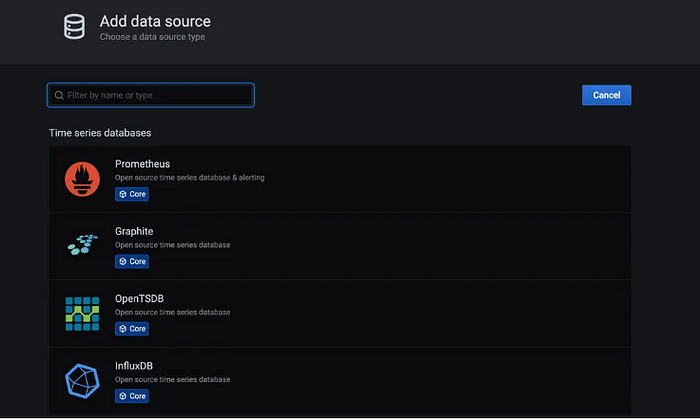
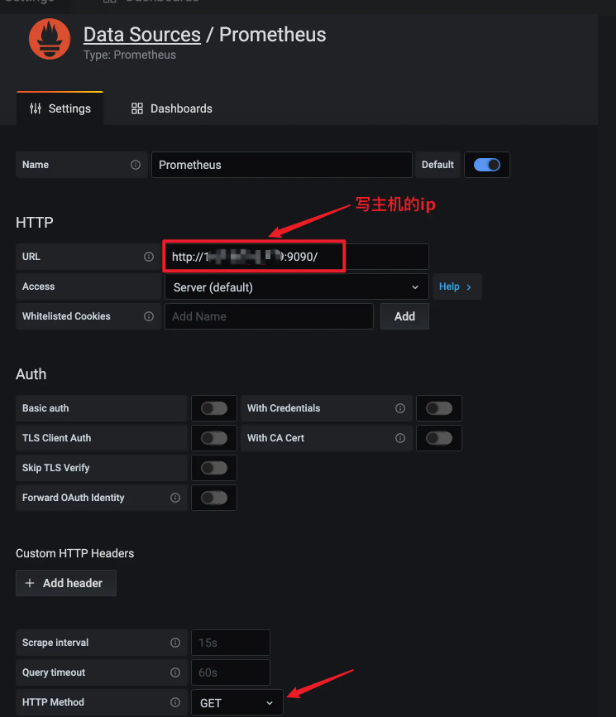
Here we choose Prometheus as the data source. Here we configure the access address of Prometheus and click Save & Test
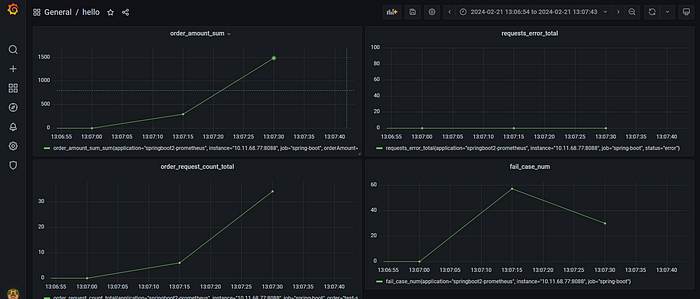
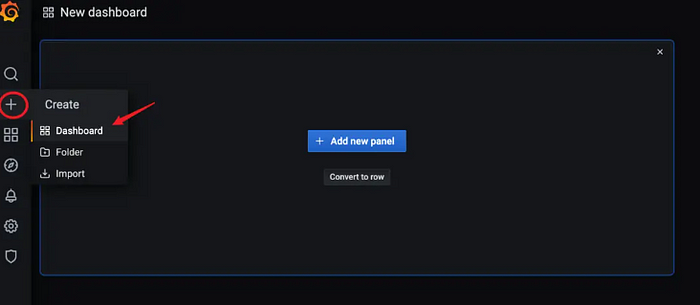
2、Build monitoring dashboard
Click the + button on the navigation bar and click Dashboard. You will see an interface similar to the following
Click + Add new panel
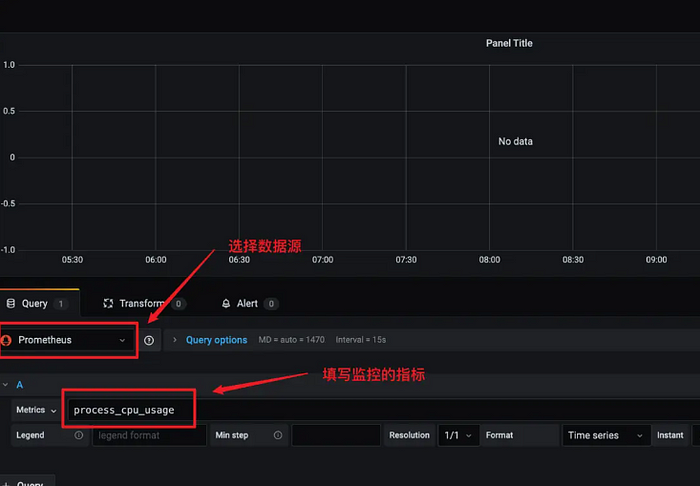
The final effect is as follows